A) 6 units of consumer goods
B) 7 units of consumer goods
C) 15 units of consumer goods
D) 22 units of consumer goods
F) A) and D)
Correct Answer

verified
Correct Answer
verified
True/False
The entrepreneur's sole function is to combine other resources (land, labour, and capital) in the production of some good or service.
B) False
Correct Answer

verified
Correct Answer
verified
Multiple Choice
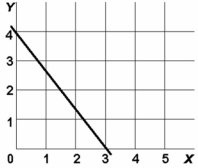 -In the above diagram variables x and y are:
A) both dependent variables.
B) directly related.
C) inversely related.
D) unrelated.
F) B) and C)
Correct Answer

verified
Correct Answer
verified
Multiple Choice
"Consumers spend their incomes to get the maximum benefit or satisfaction from the goods and services they purchase." This is a reflection of:
A) resource scarcity and the necessity of choice.
B) purposeful behaviour.
C) marginal costs which exceed marginal benefits.
D) the tradeoff problem which exists between competing goals.
F) A) and C)
Correct Answer

verified
Correct Answer
verified
Multiple Choice
Which one of the following statements is correct?
A) Relative scarcity is no longer a central notion in economics because we are in an age of abundance.
B) Most production possibilities curves are convex as viewed from the origin.
C) The production possibilities curve shows society's preferences for consumer goods relative to capital goods.
D) The central concept underlying the production possibilities curve is that of limited resources.
F) A) and C)
Correct Answer

verified
Correct Answer
verified
Multiple Choice
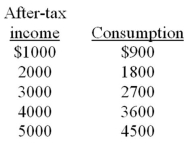 -The above data suggest that:
A) a policy of tax reduction will increase consumption.
B) a policy of tax increases will increase consumption.
C) tax changes will have no impact on consumption.
D) after-tax income should be lowered to increase consumption.
F) A) and D)
Correct Answer

verified
Correct Answer
verified
Multiple Choice
The concept of opportunity cost:
A) is irrelevant in socialistic economies because of central planning.
B) suggests that the use of resources in any particular line of production means that alternative outputs must be forgone.
C) is irrelevant if the production possibilities curve is shifting to the right.
D) suggests that insatiable wants can be fulfilled.
F) B) and C)
Correct Answer

verified
Correct Answer
verified
Multiple Choice
Suppose an economist says that "Other things equal, the lower the price of bananas, the greater the amount of bananas purchased." This statement indicates that:
A) the quantity of bananas purchased determines the price of bananas.
B) all factors other than the price of bananas (for example, consumer tastes and incomes) are assumed to be constant.
C) economists can conduct controlled laboratory experiments.
D) one cannot generalize about the relationship between the price of bananas and the quantity purchased.
F) B) and C)
Correct Answer

verified
Correct Answer
verified
Multiple Choice
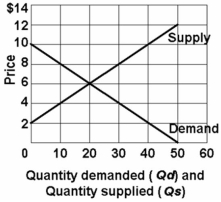 -Refer to the above graph. Using Qs for quantity supplied and P for price, which of the following equations correctly states the supply of this product?
A) P = 4 + .2Qs.
B) P = 60/Qs.
C) P = 10Qs - 2P.
D) P = 2 + .2Qs.
F) A) and B)
Correct Answer

verified
Correct Answer
verified
True/False
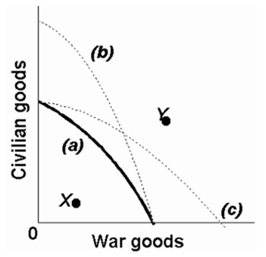 -Refer to the above production possibilities curves. Given production possibilities curve (a), point Y indicates that society is failing to use available resources efficiently.
B) False
Correct Answer

verified
Correct Answer
verified
True/False
 -Refer to the above production possibilities curves. Given production possibilities curve (a), the combination of civilian and war goods indicated by point X is unattainable to this economy.
B) False
Correct Answer

verified
False
Correct Answer
verified
Multiple Choice
 -Refer to the above table. For these data the law of increasing opportunity costs is reflected in the fact that:
A) the amount of consumer goods which must be sacrificed to get more capital goods diminishes beyond a point.
B) larger and larger amounts of capital goods must be sacrificed to get additional units of consumer goods.
C) the production possibilities data would graph as a straight downsloping line.
D) the economy's resources are presumed not to be scarce.
F) B) and D)
Correct Answer

verified
Correct Answer
verified
Multiple Choice
Production possibilities tables for two countries, North Cantina and South Cantina:
North Cantina Production possibilities (alternatives)
 South Cantina Production possibilities (alternatives)
 -Refer to the table below. According to the production possibilities schedule for the economy which produces two products, a combination of four tanks and 650 autos is: Production Possibilities
A) attainable, but involves an efficient use of society's resources.
B) attainable, but would not be in the best interests of a strong national defence.
C) not attainable because it is not listed in the schedule.
D) not attainable because society does not have sufficient resources to produce this combination.
F) B) and D)
Correct Answer

verified
Correct Answer
verified
True/False
 -Refer to the above production possibilities curves. The movement from curve (a) to curve (b) implies an increase in the quantity and/or quality of society's productive resources.
B) False
Correct Answer

verified
True
Correct Answer
verified
True/False
 -The present choice of position on the production possibilities curve will not influence the future location of the curve.
B) False
Correct Answer

verified
Correct Answer
verified
Multiple Choice
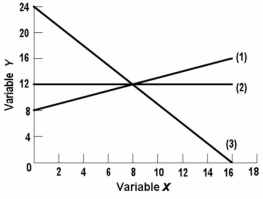 -In line (3) on the above graph, variables x and y are:
A) directly related.
B) negatively related.
C) positively related.
D) nonlinearly related.
F) A) and B)
Correct Answer

verified
Correct Answer
verified
Multiple Choice
Refer to the following production possibilities curves. Curve (a) is the current curve for the economy. Given production possibilities curve (a) , the combination of capital and consumer goods indicated by point L: 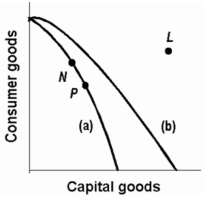
A) would entail substantial unemployment.
B) would entail an inefficient use of society's resources.
C) is beyond the productive capacity of this society.
D) suggests the productive capacity of the system is declining.
F) None of the above
Correct Answer

verified
Correct Answer
verified
Multiple Choice
A point inside the production possibilities curve is:
A) attainable and the economy is efficient.
B) attainable, but the economy is inefficient.
C) unattainable, but the economy is inefficient.
D) unattainable and the economy is efficient.
F) A) and B)
Correct Answer

verified
Correct Answer
verified
Multiple Choice
 -In the above diagram the equation for this line is:
A) y = 4 - 11/3 x.
B) y = 3 + 3/4 x.
C) y = 4 - 3/4 x.
D) y = 4 + 11/3 x.
F) A) and B)
Correct Answer

verified
Correct Answer
verified
Multiple Choice
Refer to the diagram below. The concave shape of each production possibilities curve indicates that: 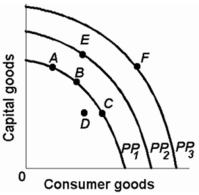
A) resources are perfectly substitutable.
B) wants are virtually unlimited.
C) prices are constant.
D) resources are not equally suited for alternative uses.
F) A) and C)
Correct Answer

verified
D
Correct Answer
verified
Showing 1 - 20 of 261
Related Exams