A) (1)
B) (2)
C) (3)
D) (4)
E) none of the above
G) A) and D)
Correct Answer

verified
Correct Answer
verified
Multiple Choice
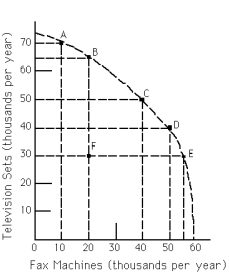
Exhibit 2-5  -Refer to Exhibit 2-5.Which of the following labeled points are productive efficient?
A) A,B,C,D,and E
B) B,C and D only
C) C only
D) All of the points are productive efficient.
E) None of the points are productive efficient.
G) A) and E)
Correct Answer

verified
Correct Answer
verified
Multiple Choice
Productive efficiency implies that
A) all consumers' wants are satisfied.
B) no advance in technology will occur in the future.
C) the attainable region is greater than the unattainable region.
D) gains are impossible in one area without losses in another.
E) all of the above
G) A) and C)
Correct Answer

verified
Correct Answer
verified
Multiple Choice
Exhibit 2-5  -Refer to Exhibit 2-5.The economy is currently operating at point F.The opportunity cost of moving to point E is approximately
A) 35 fax machines.
B) 55 fax machines.
C) zero fax machines.
D) 40 fax machines.
F) A) and B)
Correct Answer

verified
Correct Answer
verified
Multiple Choice
If an economy can produce a maximum of 10 units of good X and the opportunity cost of 1X is always 2Y,then what is the maximum units of good Y the economy can produce?
A) 5
B) 200
C) 20
D) 500
E) none of the above
G) All of the above
Correct Answer

verified
Correct Answer
verified
Multiple Choice
A PPF is more likely to be a downward-sloping curve that is bowed outward than a downward-sloping straight line because most resources are
A) better suited for the production of some goods than others.
B) used efficiently.
C) relatively cheap at low levels of output.
D) used to produce consumption goods.
F) None of the above
Correct Answer

verified
Correct Answer
verified
Multiple Choice
Exhibit 2-5  -Refer to Exhibit 2-5.As more fax machines are produced,the opportunity cost of producing them
A) increases.
B) decreases.
C) remains constant.
D) first decreases and then increases.
F) C) and D)
Correct Answer

verified
Correct Answer
verified
Multiple Choice
Exhibit 2-9
 -Refer to Exhibit 2-9.Who has the comparative advantage in the production of good A?
A) Alex
B) Adam
C) Both Alex and Adam
D) Neither Alex nor Adam
F) A) and D)
Correct Answer

verified
Correct Answer
verified
Multiple Choice
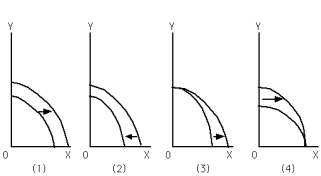
Exhibit 2-6  -Refer to Exhibit 2-6.Which graph depicts the result of an increase in the unemployment rate?
A) (1)
B) (2)
C) (3)
D) (4)
E) none of the above
G) D) and E)
Correct Answer

verified
Correct Answer
verified
Multiple Choice
The economy can produce 15X and 15Y,10X and 20Y,5X and 25Y,or 0X and 30Y.It follows that opportunity cost of 1X is ___Y.
A) 4.0
B) 5.0
C) 2.5
D) 1.0
E) none of the above
G) A) and B)
Correct Answer

verified
Correct Answer
verified
Multiple Choice
Exhibit 2-6  -Refer to Exhibit 2-6.Which graph depicts the result of a decrease in the unemployment rate?
A) (1)
B) (2)
C) (3)
D) (4)
E) none of the above
G) A) and B)
Correct Answer

verified
Correct Answer
verified
Multiple Choice
Exhibit 2-8
 -Refer to Exhibit 2-8.For Maria,the opportunity cost of producing one unit of good Y is ___________ unit(s) of good X.
A) 2.00
B) 1.00
C) 10.00
D) 0.50
F) A) and B)
Correct Answer

verified
Correct Answer
verified
Multiple Choice
If there is always a 4-for-1 tradeoff between producing good X and good Y,it follows that the opportunity cost of X (in terms of Y) ____________________ and the PPF for these two goods is ______________________.
A) decreases at low levels of X;a straight line
B) rises at high levels of Y;bowed-outward
C) decreases at high levels of X;bowed-outward
D) is always the same;a straight line
F) A) and C)
Correct Answer

verified
Correct Answer
verified
Multiple Choice
Exhibit 2-5  -Refer to Exhibit 2-5.The opportunity cost of moving from point C to point B is
A) 15,000 televisions.
B) 15,000 fax machines.
C) 10,000 televisions.
D) 20,000 fax machines.
F) B) and C)
Correct Answer

verified
Correct Answer
verified
Multiple Choice
Exhibit 2-6  -Refer to Exhibit 2-6.Which graph depicts society's choice to produce more of good X and less of good Y?
A) (1)
B) (2)
C) (3)
D) (4)
E) none of the above
G) D) and E)
Correct Answer

verified
Correct Answer
verified
Multiple Choice
Country 1 produces two goods,A and B.Country 2 produces the same two goods.Currently,country 1 produces 100A and 200B and country 2 produces 300A and 700B.Which of the following statements is true?
A) If country 1 is on its production possibilities frontier,then country 2 must be on its PPF,too.
B) The PPF for country 1 is necessarily closer to the origin (or further to the left) than the PPF for country 2.
C) If country 1 is productive inefficient,then so is country 2.
D) Country 2 is operating on its PPF,but country 1 is clearly not operating on its PPF.
E) none of the above
G) B) and E)
Correct Answer

verified
Correct Answer
verified
Multiple Choice
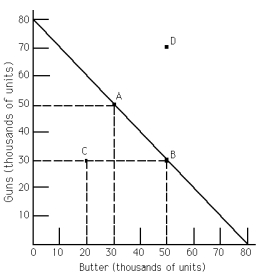
Exhibit 2-1  -Refer to Exhibit 2-1.The PPF illustrates
A) constant opportunity costs between guns and butter.
B) that guns are more important than butter.
C) increasing opportunity costs between guns and butter.
D) the opportunity cost of one unit of guns is four units of butter.
E) none of the above
G) C) and D)
Correct Answer

verified
Correct Answer
verified
Multiple Choice
If an economy can produce a maximum of 100 units of good X and the opportunity cost of 1X is always 5Y,then what is the maximum number of units of good Y the economy can produce?
A) 250
B) 100
C) 20
D) 500
E) none of the above
G) D) and E)
Correct Answer

verified
Correct Answer
verified
Multiple Choice
Exhibit 2-8
 -Refer to Exhibit 2-8.For Maria,the opportunity cost of producing one unit of good X is ___________ unit(s) of good Y.
A) 2.00
B) 1.00
C) 10.00
D) 0.50
F) A) and C)
Correct Answer

verified
Correct Answer
verified
Multiple Choice
If there is always a three-for-one tradeoff between goods X and Y,then the PPF between X and Y is
A) a downward-sloping curve that is bowed outward.
B) a downward-sloping curve that is bowed inward.
C) a downward-sloping straight line.
D) an upward-sloping straight line.
F) A) and B)
Correct Answer

verified
Correct Answer
verified
Showing 21 - 40 of 149
Related Exams